Your team opens PageSpeed Insights on Monday and sees a better performance score. No one remembers changing the page. Is this a win to report, or a number to investigate?
Start with the experience you are trying to improve. A Lighthouse score comes from one controlled test. The real-user figures in PageSpeed Insights summarise visits over a rolling period. Both are useful, but they answer different questions. Before claiming a faster site, check which number moved, what page and device it represents, and whether people experienced the change.
First, identify the number that changed
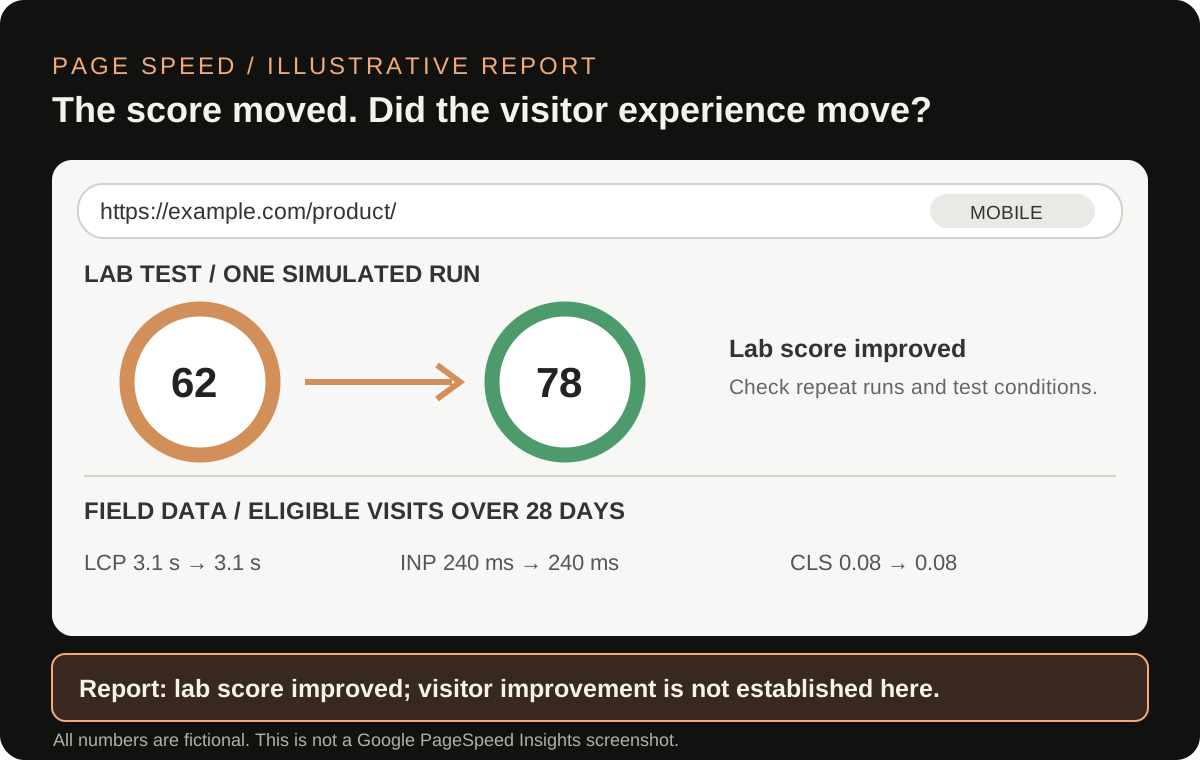
PageSpeed Insights presents two broad kinds of data:
| What you see | What it describes | Best use |
|---|---|---|
| Lighthouse performance score and lab diagnostics | One simulated page load under specified device and network conditions | Find possible causes and test a fix quickly |
| Real-user data from Chrome UX Report (CrUX) | Aggregated experiences of eligible Chrome users over the previous 28 days | Judge how the page or site performed for users |
Google explains this distinction in its PageSpeed Insights documentation. A good lab score does not guarantee a good real-user experience. The reverse can happen too. The lab and field numbers can disagree because people use different devices, networks and page states from the one simulated in the test. Google provides a detailed explanation of those differences.
The large coloured score at the top can draw attention away from the question that matters: what changed for the visitor? Keep the score as a diagnostic clue, not the outcome itself.
Check whether you are comparing the same thing
Before opening a ticket or reporting a win, write down:
- Exact URL: Was the test for the same page both times? A homepage and a product page can behave very differently.
- Device: Was one run mobile and the other desktop?
- Data level: Does the real-user panel say “This URL,” or has it fallen back to Origin data for the whole site? If a URL has insufficient CrUX data, PageSpeed Insights may show origin data instead. Chrome's guide to CrUX in PageSpeed Insights.
- Test details: Check the Lighthouse version, test time and environment shown in the report. A lab score may vary even when a page has not changed.
- Page state: Was a cookie notice, chat widget, ad, logged-in state or experiment present in one run but not the other?
If any of these differ, you do not have a clean before-and-after comparison. Save both reports and label the difference. Do not silently average them.
Use the right metric to describe the problem
The three Core Web Vitals describe different parts of the experience:
- Largest Contentful Paint (LCP): when the main visible content loads.
- Interaction to Next Paint (INP): how quickly the page responds to a user's interaction.
- Cumulative Layout Shift (CLS): how much visible content unexpectedly moves.
These are real-user experience measures, with definitions and recommended thresholds from Google Search Central. Look at the metric behind a changed status rather than treating one overall score as a diagnosis. A page can load its hero quickly and still respond slowly when someone opens a menu. A stable layout will not fix a delayed main image.
For real-user data, also check whether you are looking at the URL or an origin-wide summary. An origin figure can improve because a different set of pages or visitors contributes to it; it does not prove that your target page improved. The 28-day window also means a fix made yesterday will not instantly replace the older visits in the field panel.
A worked decision: score up, no page change
Imagine an illustrative product page. On one day its mobile Lighthouse score is 62; on the next it is 79. The team made no release. The PageSpeed Insights field panel still shows the same URL-level LCP category.
The responsible decision is to investigate, not announce a performance gain. Save the two test links. Check the test environment, page state and metric details. Run a few comparable lab tests to see whether the change repeats. If the page's real-user data exists, watch that over a longer period. If it does not, use lab tests to diagnose specific problems without claiming that visitors have already benefited.
Those numbers are invented to show the decision. They are not results from this site or a client project.
Now imagine a different case: the main image was compressed, comparable lab tests repeatedly show a faster LCP, and the URL's field LCP improves as newer visits enter the 28-day window. That is stronger evidence that the change helped. Still note the date, device and data source when you report it.
What if there is no real-user data?
New or low-traffic URLs may not have enough eligible CrUX data for a URL-level panel. PageSpeed Insights may show origin data or “No Data.” That does not mean the page is fast or slow. It means this public field dataset cannot answer the page-level question yet. Chrome explains the fallback and no-data states.
Use a repeatable lab setup to identify concrete issues. Check the page on a real mobile device if you can. Record the exact issue you fixed, such as an image loading late or a menu taking too long to respond. Avoid presenting a lab score as a measured improvement for all visitors.
A five-minute review before you report a win
Create a short record with these fields:
| Field | What to write |
|---|---|
| URL and device | The exact page and mobile or desktop view |
| Change date | The release or configuration change, if one occurred |
| Lab comparison | Same tool, version and conditions where possible; metric that moved |
| Field comparison | URL or origin, metric, collection period and whether data exists |
| Page-state check | Cookie notice, ads, experiments or third-party scripts that differed |
| Conclusion | Confirmed improvement, likely improvement awaiting field data, or inconclusive |
| Next check | Owner and date to review the affected metric again |
If the conclusion is inconclusive, say so plainly. A useful update might be: “The simulated mobile test improved in repeat runs after the image change. We do not yet have enough URL-level real-user data to confirm the effect for visitors.”
Where does SEO fit?
Core Web Vitals matter for user experience, and Google's page experience guidance says they are used by its ranking systems. Google also says a good tool score does not guarantee top rankings. A faster page can make content easier to use, but the score cannot replace a relevant answer to the reader's question.
So the next action is specific: identify the slow or unstable part of the page, fix it, and check the matching metric. Do not make a content or ranking claim from one green Lighthouse number.
If a page is getting impressions but few clicks, that is a separate search-result question. The guide on impressions rising while clicks stay flat helps you diagnose it before rewriting the page. If you need help turning conflicting search and page-speed reports into a clear action list, book a discussion with the URLs and reports you want to review.
Sources: Google PageSpeed Insights documentation, Chrome UX Report guidance, web.dev lab and field data guide, and Google Search Central page experience documentation. Score example is fictional. Checked 4 November 2026.

Senior SEO, AEO & GEO consultant and practitioner. I write about search strategy, the tools I build and lessons from hands-on work.
More about my work →Need help with a wider search challenge? Explore SEO consulting.